*Near Me Metrics beta is now live for Enterprise Customers.
*Enhanced data and reporting coming soon for all users. Get excited about your new dashboards by checking out the information below.
In This Article:
- What's Included in the New Data Integration
- How to Navigate the Filter Bar on Data Dashboards
- Understanding Charts Within the Dashboard
- Scheduling Report Delivery
- Action-based Alerts
1. What's Included in the New Data Integration
dbaPlatform's new data integration with Looker provides all users with an in-depth visualization of data. Enhanced reporting will include the following dashboards, with more coming soon.
-
- Performance Metrics
- Local Product Inventory
- Local Vehicle Inventory
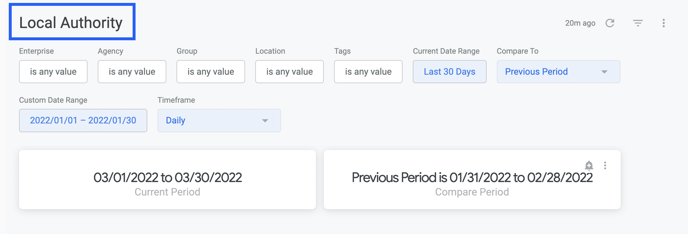
- Local Authority
- Auto Inventory Feed Health
- Retail Inventory Feed Health
Advanced reporting dashboards are available to dbaPlatform Enterprise customers. Custom dashboards for Enterprise customers can export data and reports via data file format CSV, data file format Google sheets, email, Google Drive, Dropbox, SFTP, S3 Bucket, Big Query, Azure Storage, and Zapier.
Utilize the dashboards to view, filter, and extract reports for data within your account. Enhanced reporting provides real-time data. Our favorite benefits and features include:
-
- Alert customization through email, Slack, and SMS*
- All data in real-time
- Data export capabilities
- Data sources include Google Business page insights, Google Adwords, Google Merchant Center, Bing Ad Center, Waze Ads, Local Authority, and Facebook Ads
- Data report download in PNG, JPG, and PDF* format
- Mobile responsive
* Available with enterprise license only.
2. How to Navigate the Filter Bar on Data Dashboards
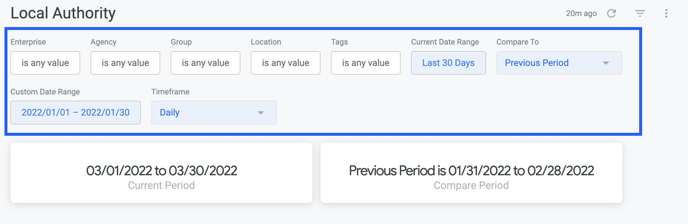
Every dashboard within a user account will display all permitted data for the user and their role and permissions. The filter bar allows users to drill down on data within a dashboard.
The filter bar will appear expanded on every dashboard when opened. The filter bar is outlined in the blue box below.
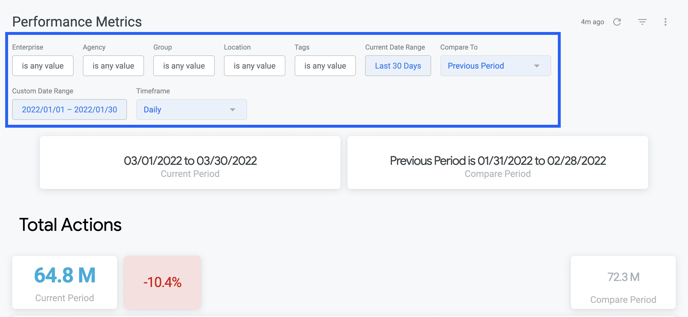
Each parameter within the filter bar can be set to a filter by measure to return the most precise results. Some examples include filtering by "contains" or "doesn't contain." See below to view the complete list of parameters.
3. How Charts Within the Dashboard Work
Charts aid in the visualization of the data. There are many charts to help make sense of the data you see.
You can analyze data further within all dashboards by selecting the Explore option on the metric charts. Click the metric box and choose how you would like to view the data.
Explore data directly on the platform or download a copy in your preferred format.
4. Scheduling Report Delivery
To receive a report from a dashboard, you will need to "Schedule delivery."
Follow the steps below to set up a customer report delivery within a dashboard:
- Select the dashboard
- Set the custom parameters within the filter bar that each report will follow. (Date range, timeframe, group, locations, etc.)
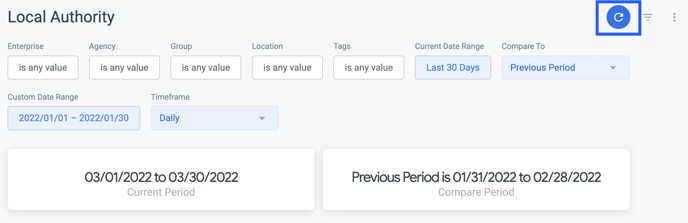
- Click the Refresh button to ensure the filters save
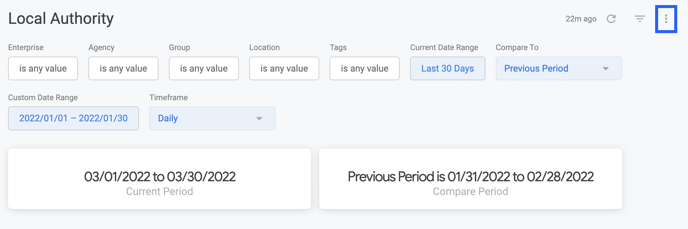
- Select the filter bar menu on the right-hand side (three vertical dots)
- Click Schedule delivery on the drop-down menu
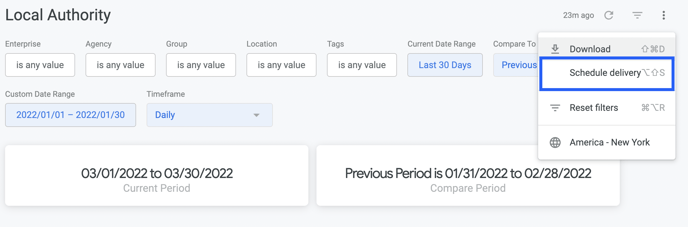
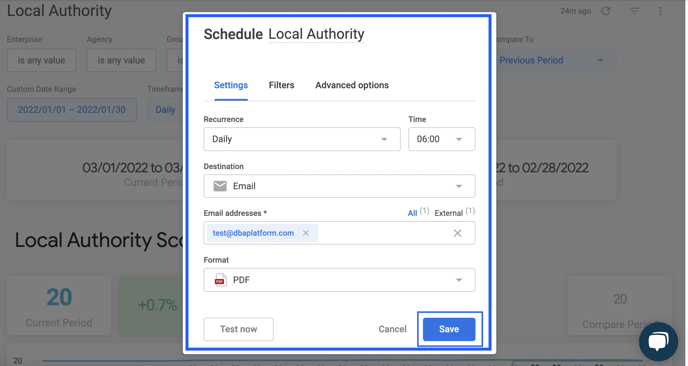
- A pop-up will appear on the screen with the report delivery options
- Set the reoccurrence, time, destination, and format
- Test the report delivery
- Save the report delivery
Now, the saved report will be delivered based on the parameters set.
Report Destinations:
- Dropbox
- Google Drive
- Slack
- Microsoft Teams
Report Formats:
- CSV Zip File
- PDF*
- PNG Visualization
* Available with enterprise license only.
5. Action-based Alerts
Alerts are query-based notifications on a given chart within a dashboard. Alerts keep you in touch with changes in your data.
Follow these steps to set up a custom alert:
- Select the bell icon on the metric box
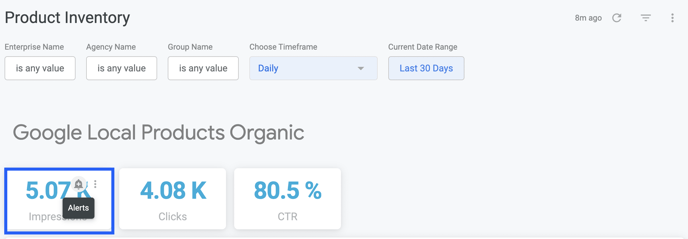
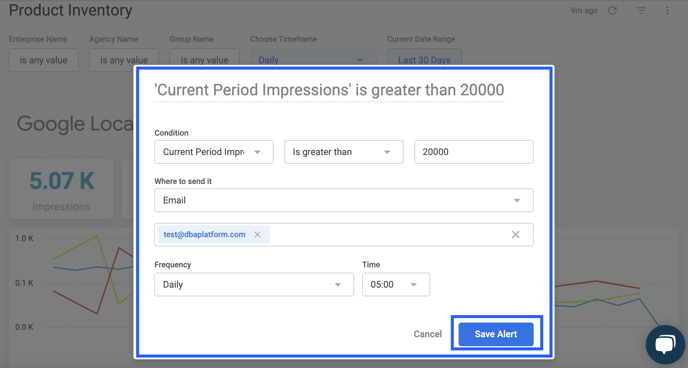
- A pop-up box will appear on your screen
- Apply desired conditions
- Select destination
- Select frequency
- Alerts examine data for the parameters set based on frequency settings.
- Save alert
Saved alerts will notify you every time the alert runs (frequency) and meets the alert conditions.
Alert Destinations:
- Slack
- SMS*
* Available with enterprise license only.
Start exploring your enhanced data and reporting today. Chat us with any questions! If you are ready to upgrade to Enterprise please contact our team at partners@dbaplatform.com.